How it works
Multiple people contribute data.
One audit-ready ledger.
VantageHSG is built for entire teams — not one sustainability person doing spreadsheet archaeology. Here is the end-to-end flow from messy operational data to defensible carbon numbers.
The pipeline
Four steps. Zero spreadsheet wall.
Ingest from anywhere
Operations uploads MTCs. AP forwards fuel slips. HR emails receipts. Finance drops SAP exports. Everything lands in one shared inbox.
Normalize and deduplicate
Wet tonnes become dry tonnes. GJ becomes MMBtu. Duplicate bills are flagged before they pollute the ledger.
Calculate from primary data
ECCC and IESO factors are version-pinned. Mass balance runs where process data is rich. EEIO fallback is disclosed.
Export audit-ready outputs
Scope 1, 2, and 3 reports with lineage tokens, Bill C-59 substantiation, and verifier-ready exports.
Interactive playground
Drive the engines yourself.
Move the sliders and watch real ECCC factors, stoichiometric mass balance, and a live SHA-256 audit seal transform your inputs into certified tonnes of CO2e — the same math that runs in production.
Drive the pipeline
Move the sliders — every formula below recalculates instantly.
Ingestion & Verification
Bill OCR · Lab Assay Ingest → JSON schema
Factor Resolution
ECCC 2024 NIR · Provincial grid lookup
Calculation Engine
Stoichiometric mass balance · Scope 1 / 2 / 3
Audit Sealing
SHA-256 hash chain · provenance token
🧮 Live math — see how inputs become certified tonnes
hash: e1e28b95f7f2e9496581c0334de9cc075b427d8cfd28cc1ef460e372056cbabc
Explainer videos
How the math works, visually.
Two 3Blue1Brown-style animations that play on load: the EAF carbon mass balance and the SHA-256 audit chain.
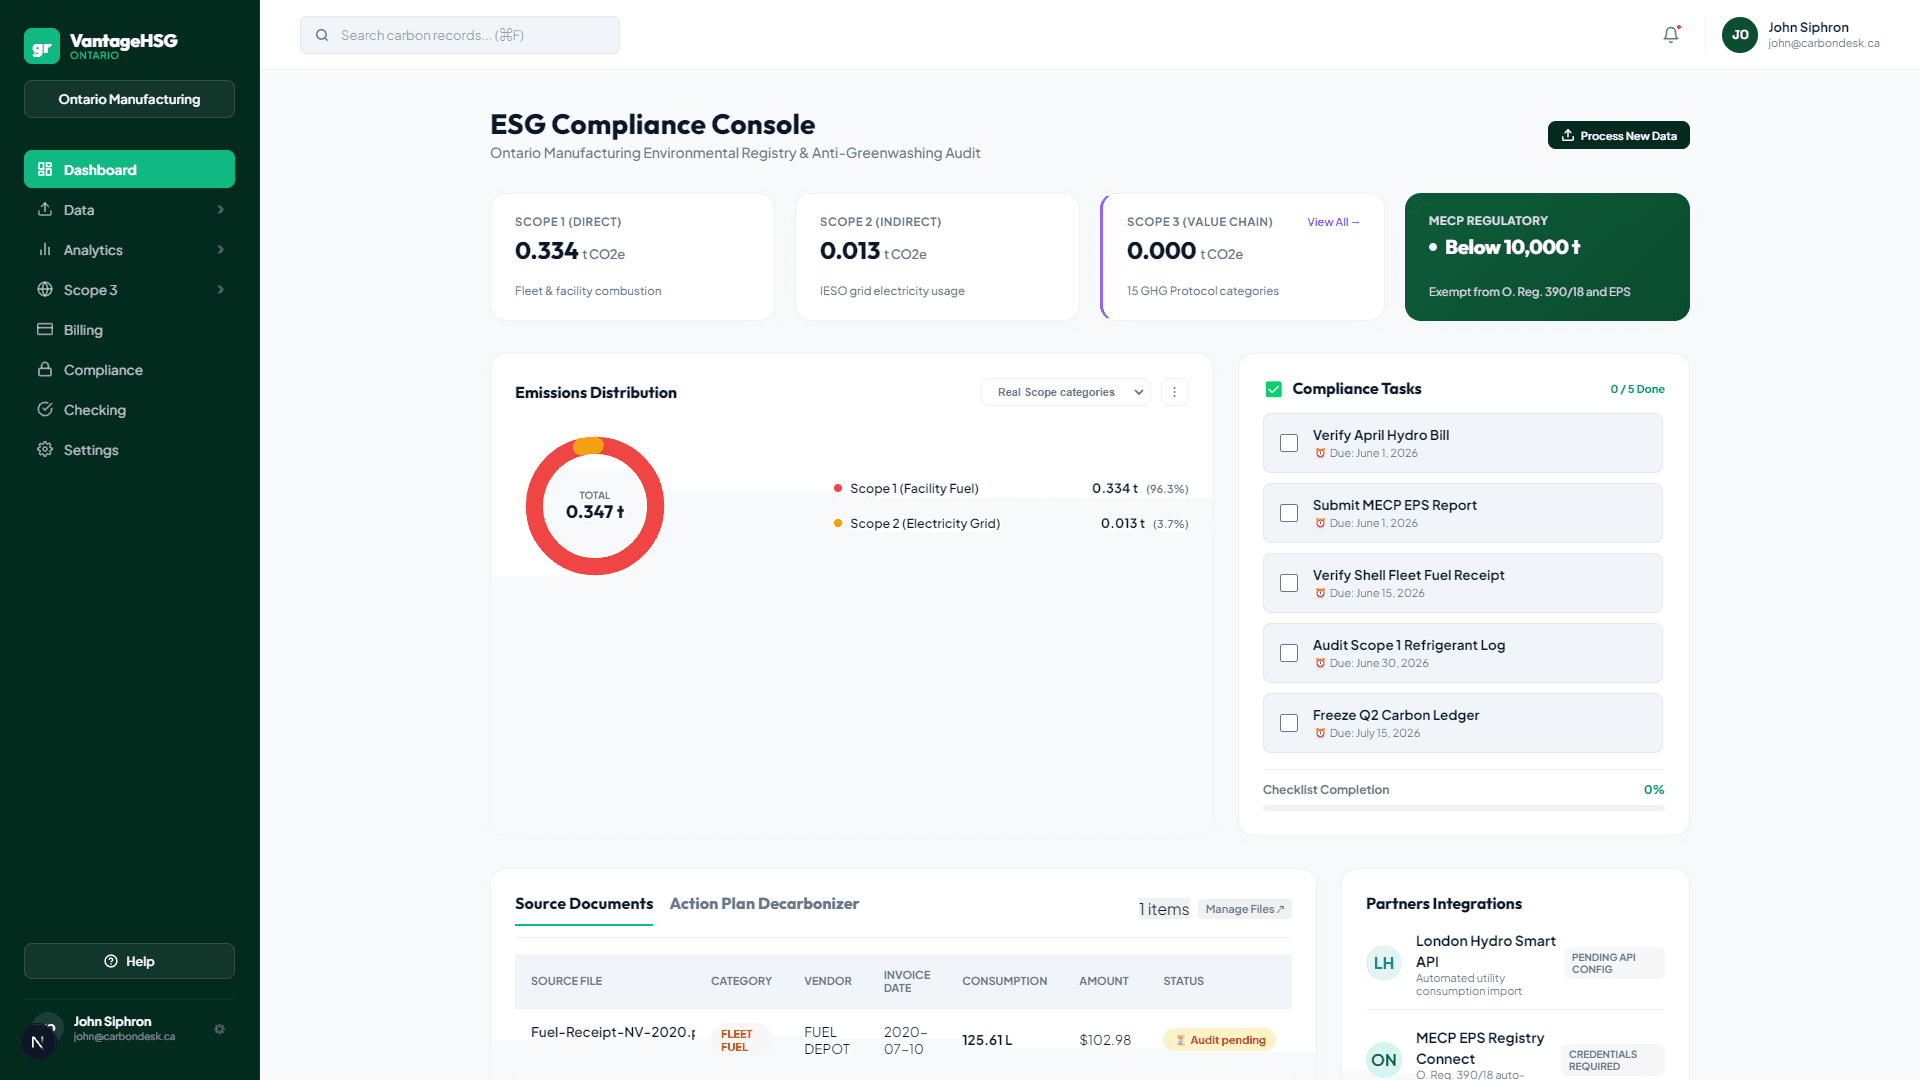
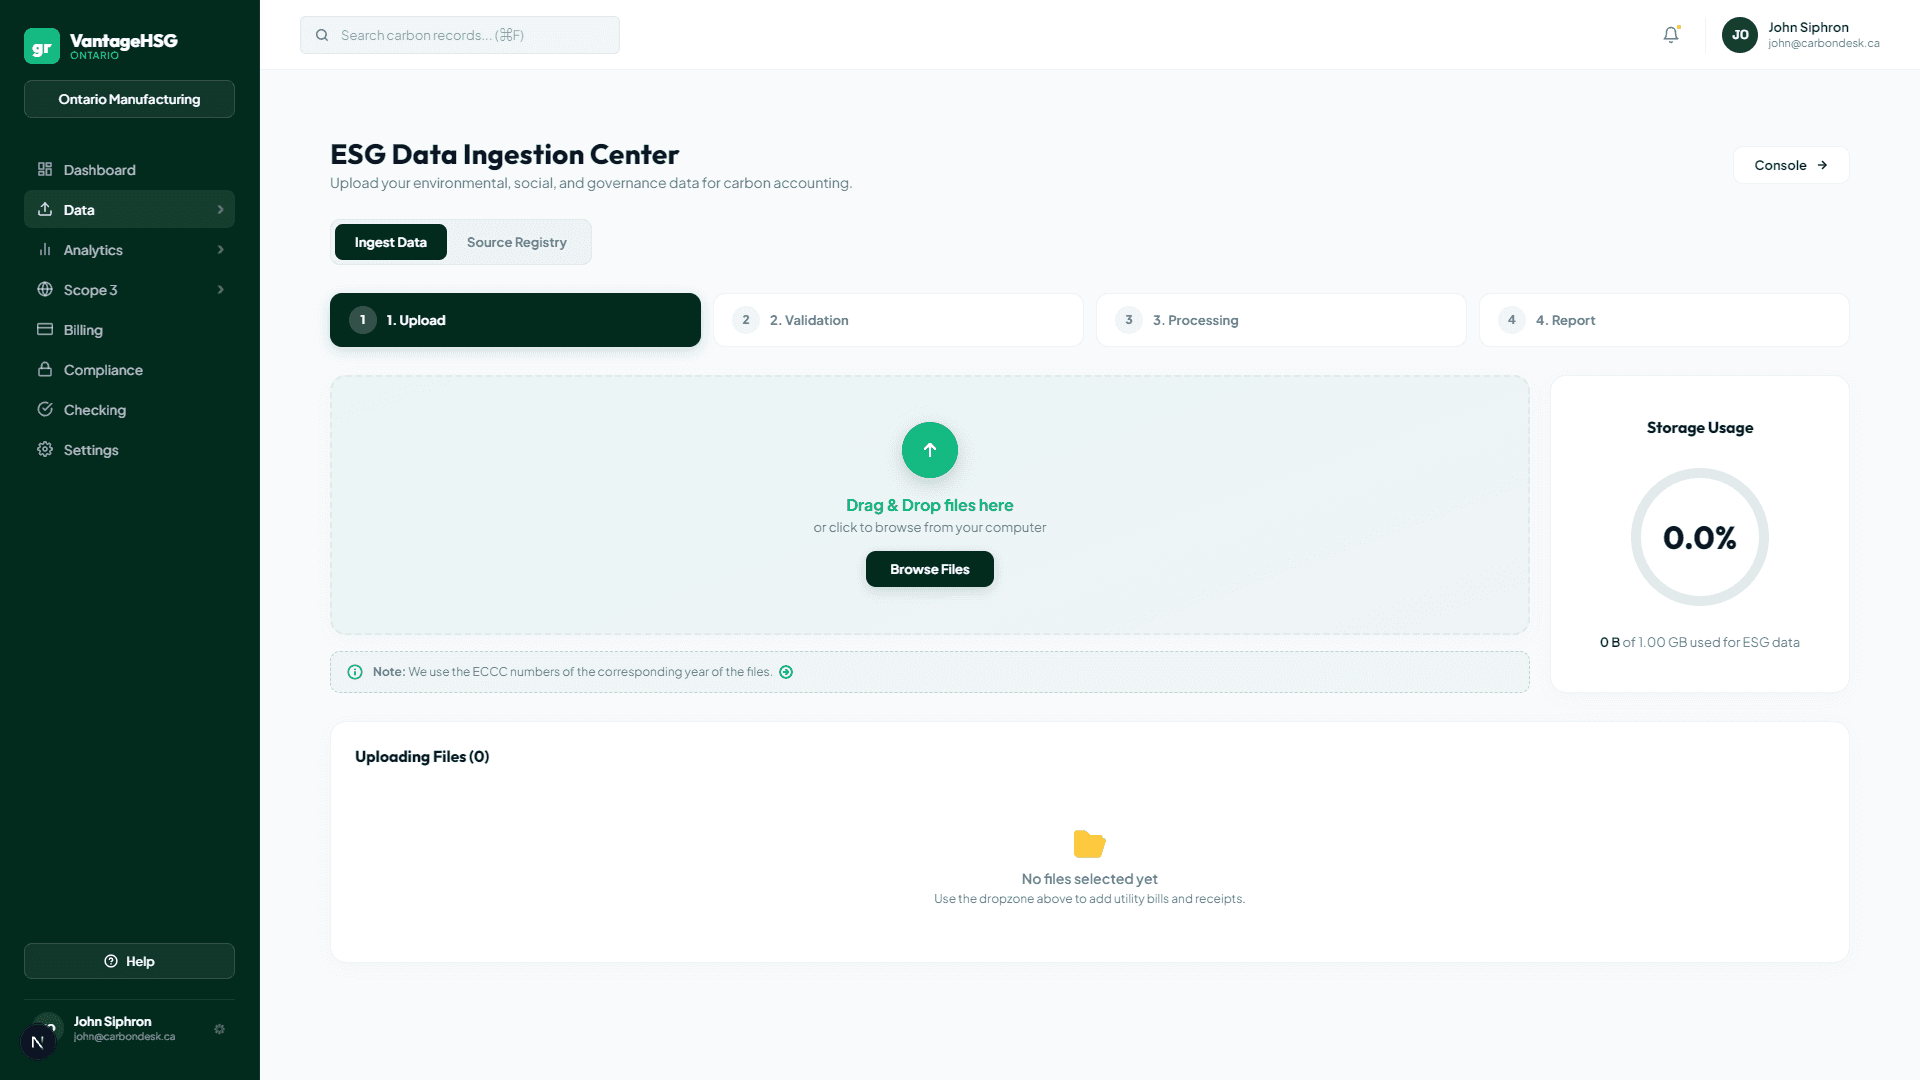
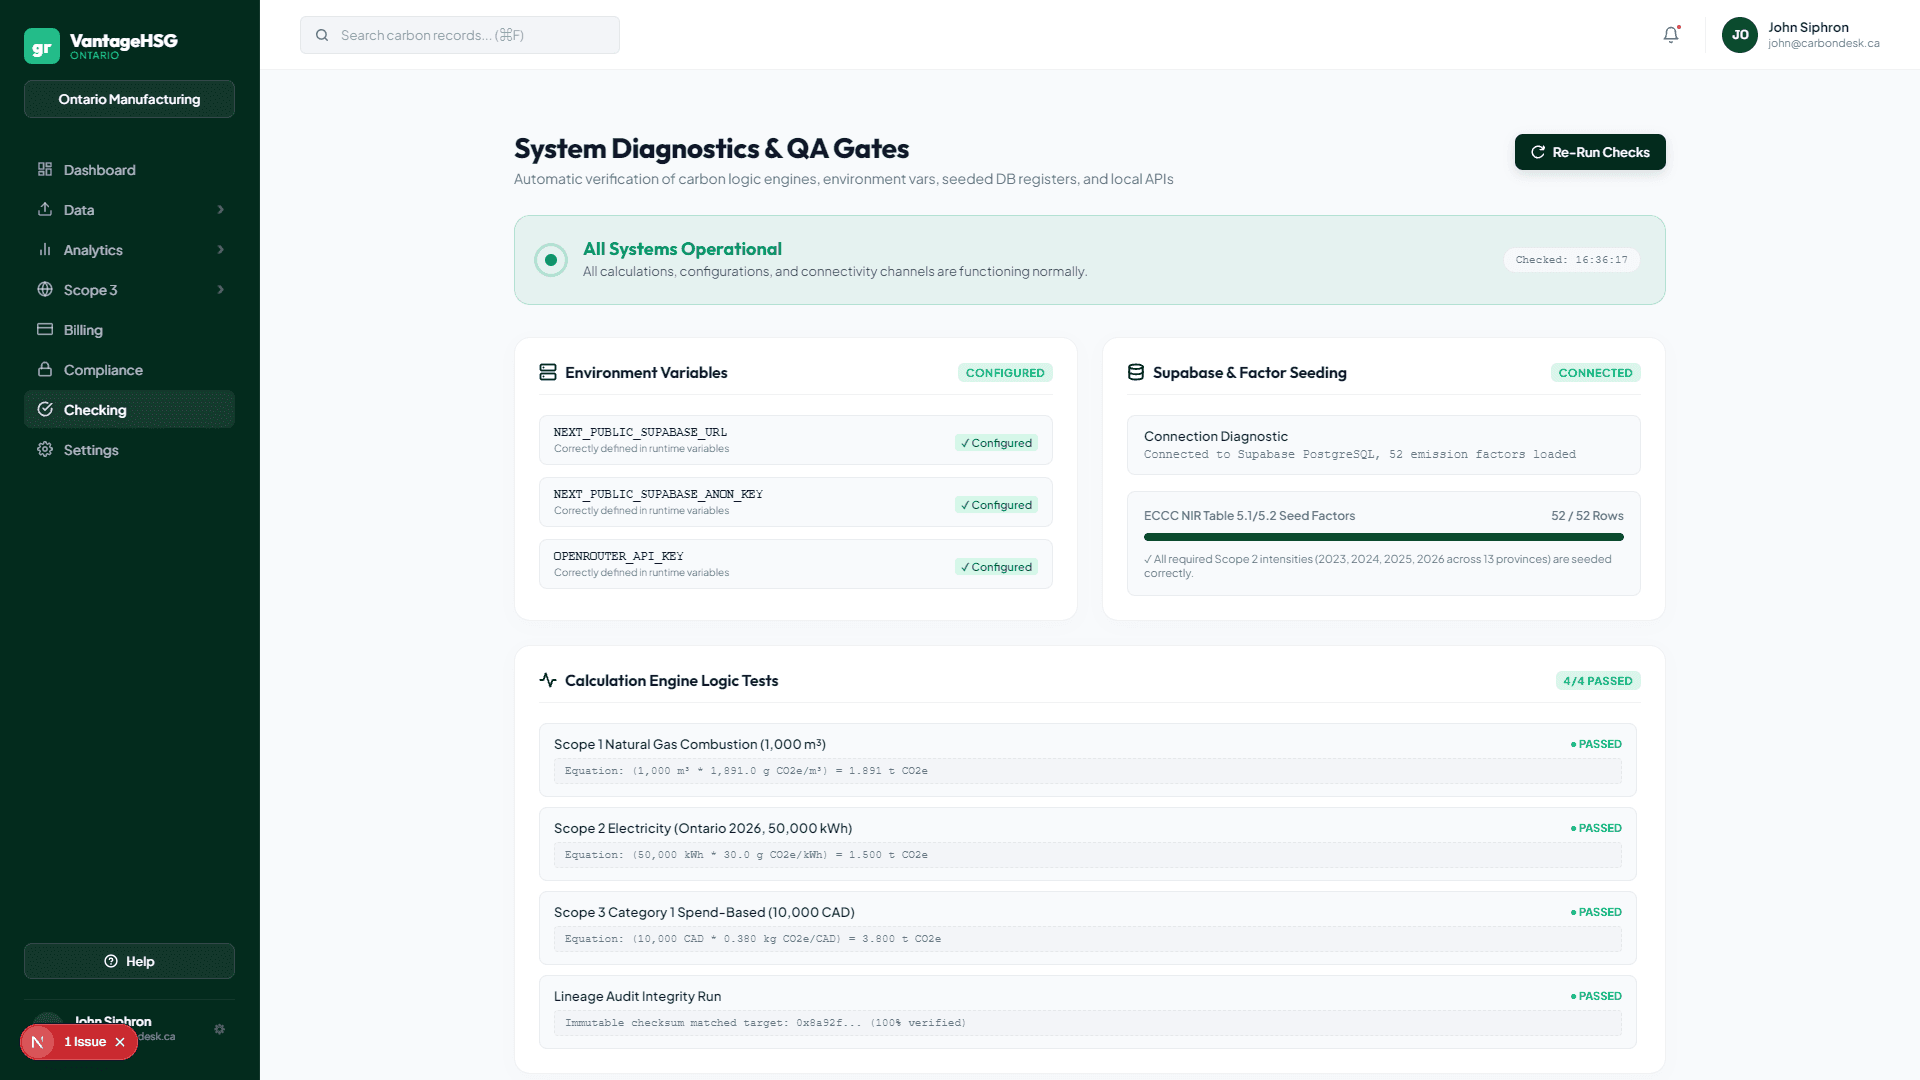
Product screenshots
What you actually get.
Real dashboard views — not abstract diagrams.
Live product demo
See the pipeline in motion.
Watch a London Hydro utility bill get extracted, calculated, and sealed to the ledger in real time.
Ready to prove it on your data?
Watch the demo, request a free sample from one document, or start a paid pilot.